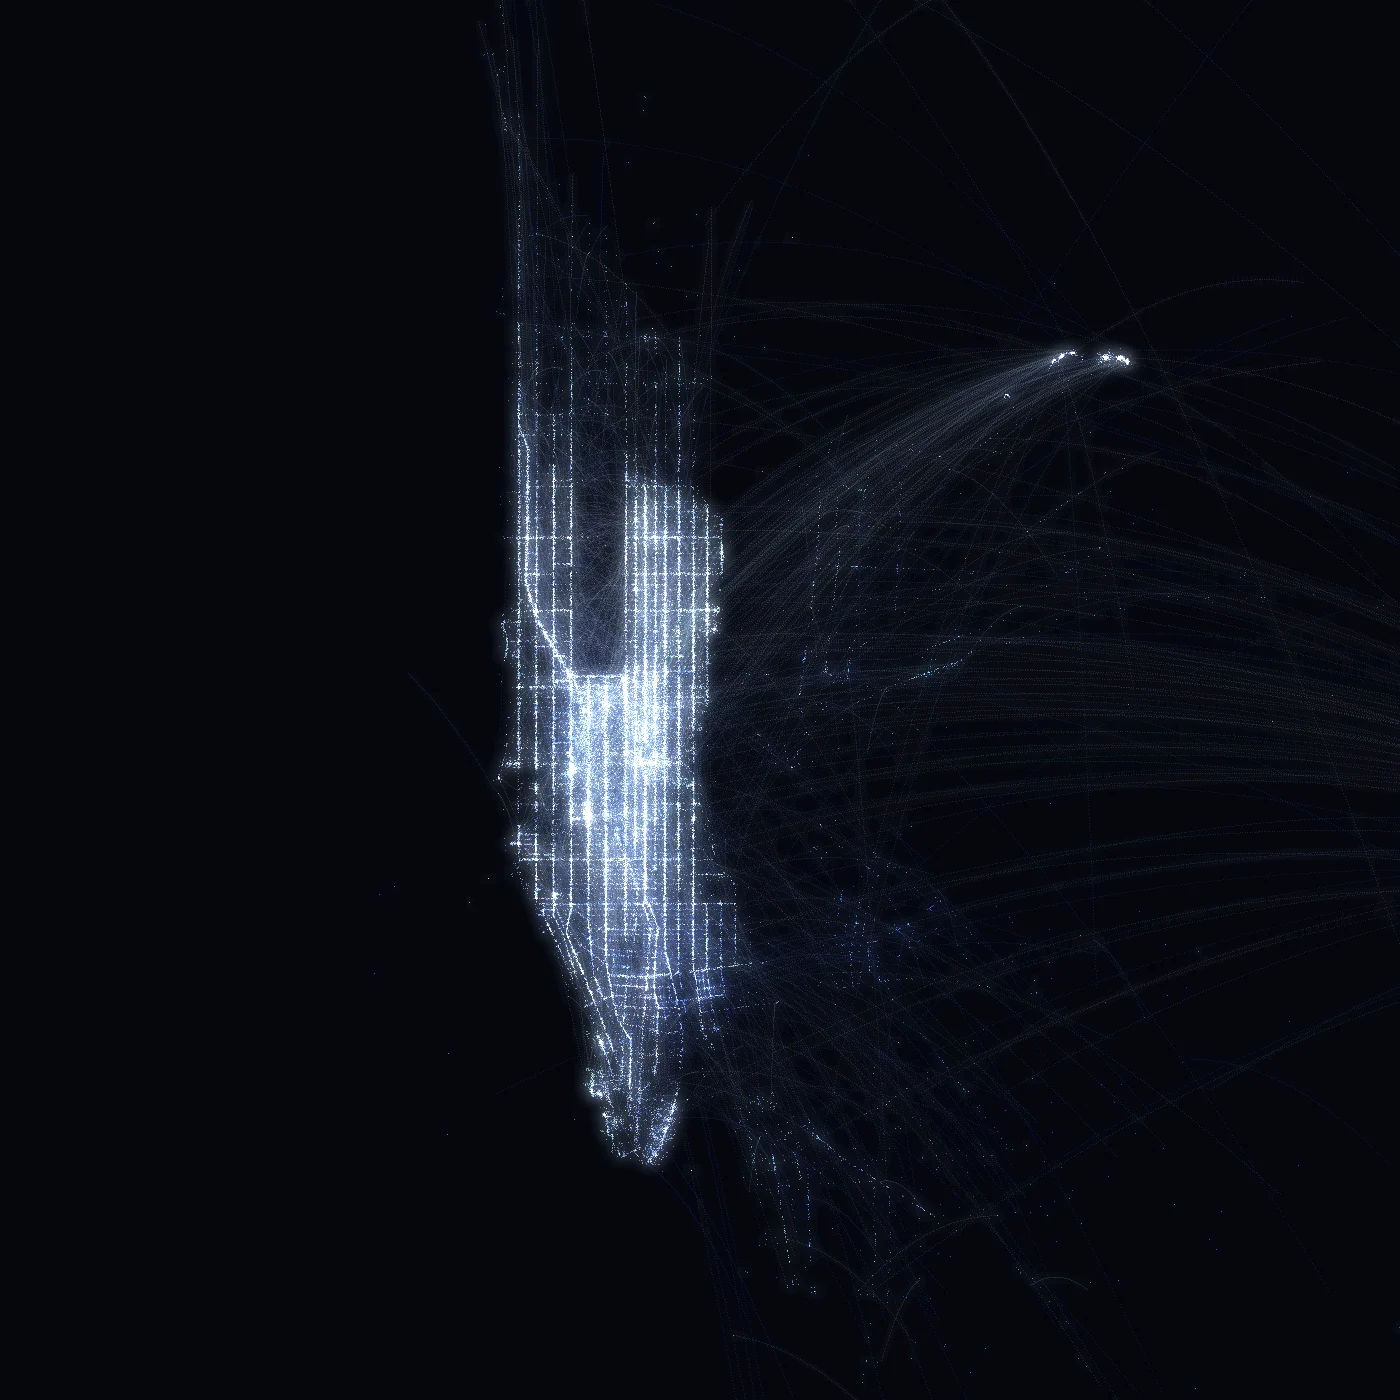
01 — The Problem
A score without a baseline says nothing
Trip duration can be predicted, but an error figure on its own is not a result. With nothing to compare against, a model that has learned the average and a model that has learned the city look much the same on paper.
- Raw trip records with outliers that would dominate any fit.
- Engineered features that overlap heavily with one another.
- Six candidate models and no honest way to rank them.
02 — What I Built
One pipeline, one split, six models, one baseline
The records are cleaned, turned into features that describe a journey rather than a row, compressed with PCA, and fed to six regressors — all of them measured against a null model that predicts the mean.
- Cleaning that removes impossible durations and out-of-range coordinates.
- Feature engineering: distance, bearing, hour and day, from raw columns.
- PCA to reduce a correlated feature space to components.
- Six regressors and a null model, scored on the same split.
03 — What Changed
The comparison is the result
Every model is reported relative to the baseline, so the number that matters is how much of the duration the features actually explain — not how small an error can be made to look.
- Each regressor is ranked against the null model, not in isolation.
- The feature set is judged by the margin it creates over the baseline.
- The pipeline is identical for every candidate, so the comparison is fair.